Tuesday, March 10, 2015
Generate index cards from your Excel 2007 backlog
First, create the word document and select your data
1. Make sure you have headings in your excel document. Example: User Story, Points, User Story ID
2. Open Word 2007 and create a new document
3. Go to the "Mailings" tab
4. Click "Start Mail Merge" and select "Step by Step Mail Merge Wizard"
5. Click "Select Recipients" and select "Use Existing List"
6. Select your excel file and then the name of the sheet (eg. Sheet1$)
Second, setup your index cards
7. In the "Mail Merge" window (usually on the right), select the "Labels" document type and click "Next: Starting document" at the bottom.
8. Click "Label options…" to choose create a custom label size for your index cards
9. Click "New Label…"
10. Use the following settings for 4 index cards per page:
○ Label name: "Index Cards"
○ Top margin: 1.5 cm
○ Side margin: 0.6 cm
○ Vertical pitch: 13 cm
○ Horizontal pitch: 10 cm
○ Page size: Letter (8 1/2 x 11 in)
○ Label height: 12 cm
○ Label width: 9 cm
○ Number across: 2
○ Number down: 2
11. Click OK (Note - you can now re-use the new "Index Cards" label format the next time you print index cards. Look under "Product Number" on the "Label Options" window)
12. Click OK again to close the "Label Options" window
Now we add data to the index cards
13. Click "Next: Select recipients"
14. If you want to select only some of your stories, use the check box column to do so. Click OK.
15. The page should now show four labels, with the first one blank and the other three containing "<
16. Click "Next: Arrange your labels"
17. In the blank label, add the static text you want to display. I like to show Story ID, Points and the User Story on the card, but you can display whatever information is relevant for your project and process.
17. To add the fields from your product backlog, place the cursor where your field should go and click "More Items". Select the field you want to add and click "Insert". Repeat for any additional fields
18. Now format your fields (bold, size, positioning etc) within the first label.
19. When you are finished, click the "Update all labels" button to move your formatting to all the index cards.
20. Click "Next: Preview your labels". At this point, you should have four index cards per page populated with your stories.
21. Click "Next: Complete the merge"
22. Now print your index cards! (make sure they are not printing double sided…)
Bonus Tip: Use the "Scotch Glue Stick Restickable Adhesive" to turn your index cards into reusable sticky notes.
Want to receive future blog posts in your inbox? Enter your email address here.

Monday, March 9, 2015
Control your Google Sites from Apps Script
// create a site, given the domain, site URL, site title and summary
var webpage = site.createWebPage("Jimmys Page", "JimmysPage", "Welcome to Jimmys site");
var annPage = site.createAnnouncementsPage("Team Announcements", "Announcements", "New announcements for the team will be posted here.");
site.createAnnouncement("Soccer Match #1", message, annPage);
Ryan Boyd
Thursday, February 26, 2015
Lessons Learned from Students use of an Online Learning Environment
"This article highlights the lessons learned from recent research into the use made of an online learning environment by workplace-based students...
(Lessons Learned) The students, being workplace-based, often found that they had distinct blocks of free time to spend studying and said that if the materials were structured into timed units, more effective workplace study could be facilitated. Although the idea of tightly timed units is counter to the idea of self-paced, needs-based learning, on a practical level it may be beneficial to students trying to fit study into their working days. Although the students appreciated the activities provided, they stated that they would have preferred more of them, and more interactivity within them.
From Public Speaking Class to CEO of Google Schmidt
- YouTube - Eric Schmidt Public Speaking Class
- Wikipedia - Eric E. Schmidt
- Portfolio.com - Dr.Eric E. Schmidt, Ph.D.
 WHO?
Eric Emerson Schmidt, Ph.D (born 1955 in Washington, D.C.) is Chairman and CEO of Google Inc and a member of the Board of Directors of Apple Inc. In contrast to Bill Gates and Steve Jobs, he has a strong (formal) educational background, including a PhD in Electrical Engineering and Computer Sciences (EECS) from the University of California, Berkeley (1982). Schmidt started of his working career as research staff for Xerox. In 1983, Schmidt joined Sun Microsystems as software manager. At Sun he led the development of Java, Suns platform-independent programming technology (Microsoft or Dot NETs arch-rival?), and defined Suns Internet software strategy. He later became chief technology officer and corporate executive officer. From 1997 to 2001, Schmidt was CEO of Novell. In 2001, Google founders Larry Page and Sergey Brin (with the assistance of executive search firm Heidrick & Struggles, Inc.) recruited Eric Schmidt to run their company under the influence of venture capitalists John Doerr and Michael Moritz (Source).
While searching for something else yesterday evening (Great discoveries often happen by accident!), I discovered this interesting YouTube video entitled: Eric Schmidt Public Speaking Class. Based on watching the video and reading the comments, I assume Schmidt is about 33 years old (1988) here, and is the general manager at Sun Microsystems. He basically wants to improve his public speaking skills, and be able to communicate better to larger audiences (Yes, as he goes up in rank, he is facing larger audiences. So better prepare!). Based on some of the given clues (video, search tags, comments and buzzer!) this seems to be a Toastmasters session. Yes, Eric Schmidt was/is a Toastmaster (I assume). Also, you will have fun watching him being grilled (by his own staff?) and evaluated by the small audience (I assume based on the noise. The camera is mostly focused on him, obviously!). Here we go:
JUICE?
Actually, the main reason for sharing with you this video is not really to show you an example of excellent public speaking. If that was the case, I would rather show you a Martin Luther King ("I have a dream..."), or Ed Tate (2000 World Champion of Public Speaking) speech. Actually, if you want to improve your public speaking skills, these two public speaking champions (in their own way!) would certainly give you some ideas and inspiration.
Hmm, lets get back on track! The real juice of this video to me, is not how he speaks, but what he says about management, leadership, innovation and organizational growth. Lets recap some of the juice.
Here is a summarized version of what Eric Schmidt said with a bit of creative flavor.
Where there is no conflict, there is no life.
-Niccolo Machiavelli
"The most important quality of a manager is his ability to lead people. Leadership comes from within, and is not something one can easily teach. It is about getting your staff excited, motivated and inspired to action. I have discovered that it is much more important to be a good leader, than actually understand what you are doing. If you are a good leader you can hire people that can teach you things.
From my experience the most successful companies are the ones where there is enormous conflict. Conflict does not mean killing one another, but instead means there is a process by which there is a disagreement. It is okay to have different points of views and disagree, because tolerance for multiple opinions and people often leads to the right decision through some kind of process.
It is really the only way to deal with the high rate of change (and continuous and disruptive innovation!) we find in the technology industry. Nothing in school prepares you for this... that was the thing that really annoyed me the most... In fact if you look in the computer industry, every one of the successful companies is run by a real tough guy, somewhere high up in the management chain, who has established a tone of conflict. A professional constructive conflict tone!
The benefits that you get from conflict from the standpoint of the company, is the ability to compete, innovate, grow and make lot of money."
"...With decades of corporate experience, Schmidt brings a grown-up approach to the Page-and-Brin show. When the two know-it-alls are locked in heated argument, it’s up to Schmidt to lead them to agreement so that the company can present a united front to employees and Wall Street. (Source) "
So you see, his early understanding, experience and ability to facilitate Creative Disagreements (A term he used during the video) has certainly helped him to succeed at Google and spark more innovation and success. Schmidt plays today a critical role in "building the corporate infrastructure needed to maintain Googles rapid growth as a company and on ensuring that quality remains high while product development cycle times are kept to a minimum. (Source)"
Overall, I am pretty sure I missed out on some of the juice from the video (and perhaps added a bit!), so you better watch the video to catch the rest (and correct me where I went wrong!). Also, I am reasonably sure that Eric Schmidts ideas about management, leadership, innovation and organizational growth has evolved since this video (19 years ago!), so you might want to Google some of his latest videos or articles to keep yourself updated.
Finally, I hope by watching this video you realize that having weaknesses or knowing about your weaknesses is actually a strength, if you deal with them. Eric Schmidt knew that he was not a good public speaker or communicator, but he also knew that if he worked on these weaknesses he would improve... (and the rest is history, still in the making!). So, there is still hope (and stay away from dope!) for people like us to succeed (in whatever we aspire to be!). We just got to keep on trying, and never give up. Hmm, I beginning to sound like a motivation speaker, so I better stop here.
Anyway, have fun learning something from this video. This video could also be an excellent trigger for class/online discussions :)
Wednesday, February 18, 2015
Windows 8 Enterprise 32 and 64 Bit Full version Official download direct from Microsoft In single link ISO

Info:
Windows 8 Enterprise is the reverse-mullet of operating systems: all party in front and business in the back. Up front, the new Start screen and touch-focused interface are more focused on users having a good time—one can not imagine many productivity applications for having access to content based on a gamertag, for example. Behind the tiles, the Desktop is where all the real work will happen.
And even at the Desktop level, Windows 8 Enterprise does not wear its business credibility on its sleeves. The exclusive features in the volume-licensed version of Windows 8 packaged specifically for business users are for the most part under the covers and barely visible. But they make it possible for users to work more securely, and take their work with them when they untether from the LAN—or, with one new feature, when they unplug their boot thumbdrive from the PC.
There are six features exclusive to Windows 8 Enterprise that aim to make it friendlier for business use:
Windows to Go capability, which allows users to boot a secured image of Windows from a USB drive
BranchCache content staging and network storage caching feature
AppLocker application access control
DirectAccess remote access technology
Enhanced VDI support for touch-based Windows devices
"Side-loading" of internal applications developed using the "Metro" interface
Not all of these features are new in Windows 8. DirectAccess, AppLocker, and BranchCache were available in Windows 7 Enterprise and Ultimate, as was VDI support. The improvements in BranchCache, VDI support, and DirectAccess are also dependent on changes in Windows Server 2012. And other than Windows to Go and VDI, the features are largely hidden from the end-user and depend on Active Directory and Windows group policy settings—and in some cases Windows PowerShell—to be configured.
But are these features in and of themselves enough for businesses to justify upgrading—and dealing with the user retraining, software testing, and other hassles that come with a major operating system upgrade? For companies that have volume licensing already in place, for whom a "step-up" fee may not be that major a financial consideration, the other hard and soft costs of upgrading may outweigh any benefits from the internal improvements of Windows 8 itself. Much of the decision will rest on whether or not to embrace the new Windows 8 application development model, the adoption of x86-based tablets, and considerations beyond the technical soundness of the platform itself.
The good news is that Windows 8 Enterprise is ready to go when businesses decide to be assimilated—and IT pros wont have to change much about how they currently support Windows desktops and notebooks to accommodate the change. Some of the new features of Windows 8 Enterprise may not be easy to deploy immediately because of a lack of supporting devices and applications, however. So it might be a while before many businesses feel ready to stop fearing the Start screen and love Windows 8 Enterprise. Read more
System requirements:
- Processor: 1 gigahertz (GHz) or faster with support for PAE, NX, and SSE2 (more info)
- RAM: 1 gigabyte (GB) (32-bit) or 2 GB (64-bit)
- Hard disk space: 16 GB (32-bit) or 20 GB (64-bit)
- Graphics card: Microsoft DirectX 9 graphics device with WDDM driver
1. After Downloading Windows 8 open it and copy all files to USB and restart your PC and Boot from USB.
2. it will working 100%.........! Enjoy
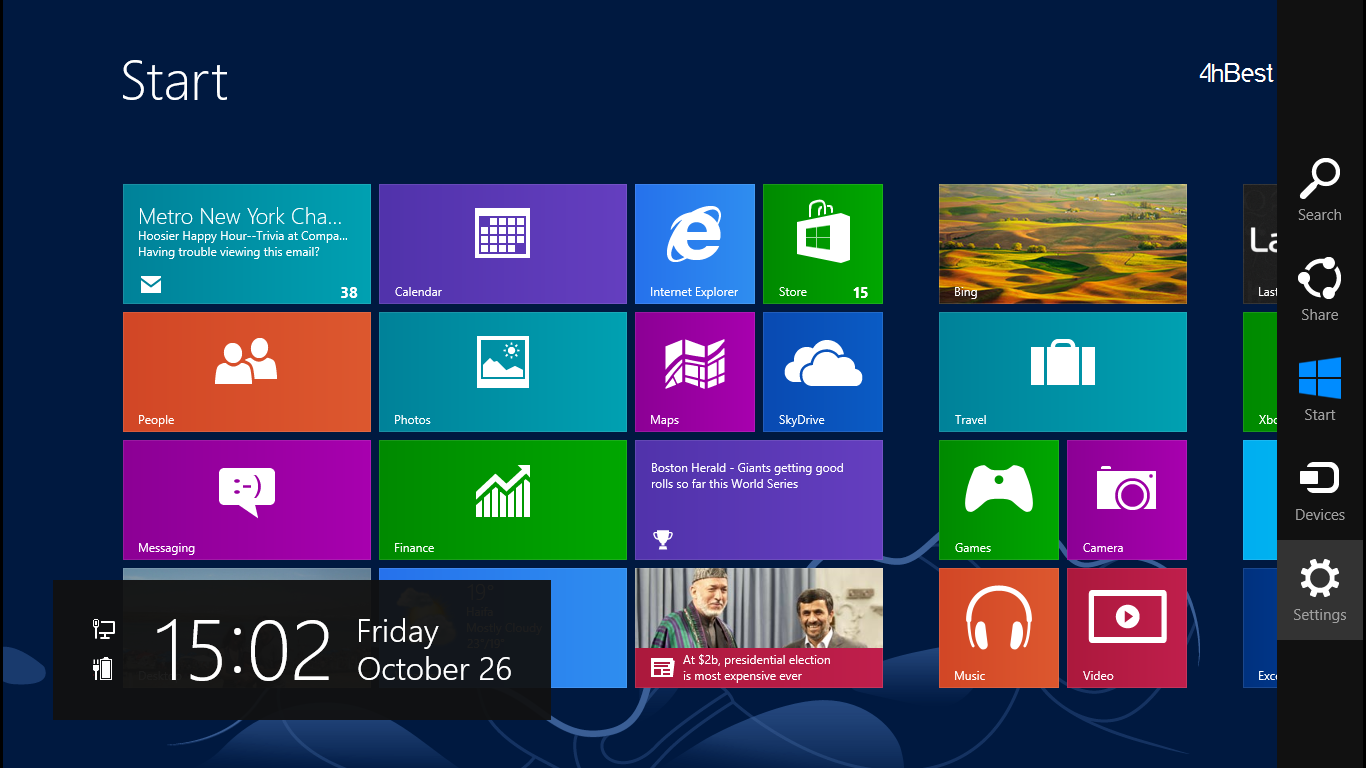
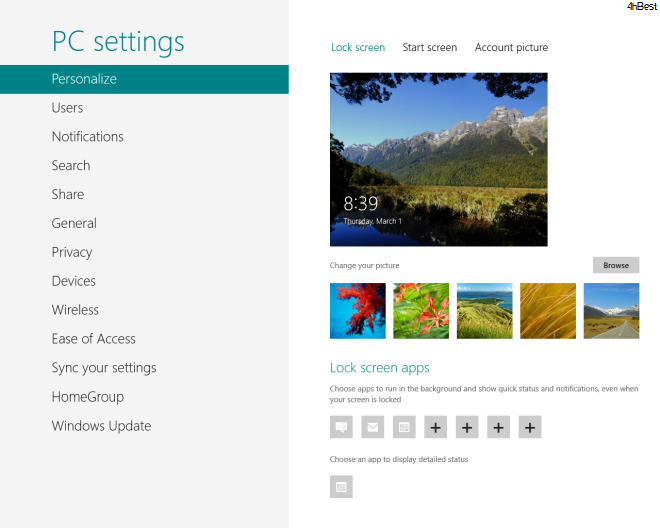
Screen Shots: Click on the image to view large screen
 |  |  |
C Program to delete an element from an Array

#include<iostream.h>
#include<process.h>
#include<conio.h>
void main()
{
clrscr();
int a[50],x,n,i,j,b[50];
cout<<"How many elements of Array you want to create?";
cin>>n;
cout<<"Enter elements of Array
";
for(i=0;i<n;++i)
cin>>a[i];
cout<<"Enter element to delete:";
cin>>x;
for(i=0,j=0;i<n;++i)
{
if(a[i]!=x)
b[j++]=a[i];
}
if(j==n)
{
cout<<"
Soory!!!Element is not in the Array";
exit(0);
}
else
{
cout<<"
New Array is ";
for(i=0;i<j;i++)
cout<<b[i]<<" ";
}
getch();
}
Saturday, February 14, 2015
Differences between Reporting and Analysis –Theory Points from Brent Dykes blog
Reporting | Analysis |
Purpose | |
Definition 1. The process of organizing data into informational summaries in order to monitor how different areas of a business are performing. | Definition 1.The process of exploring data and reports in order to extract meaningful insights, which can be used to better understand and improve business performance. |
2. Reporting translates raw data into information | 2. Analysis transforms data and information into insights. |
3. Good reporting should raise questions about the business from its end users | 3.The goal of analysis is to answer questions by interpreting the data at a deeper level and providing actionable recommendations |
4. Reporting shows you what is happening | 4. Analysis focuses on explaining why it is happening and what you can do about it. |
Tasks | |
5.Reporting: Building, configuring, consolidating, organizing, formatting, and summarizing. | 5. Analysis: focuses on different tasks such as questioning, examining, interpreting, comparing, and confirming. |
Outputs/Approach | |
6. Reporting follows a push approach | 6.Analysis follows a pull approach |
7. Reports are pushed to users who are then expected to extract meaningful insights and take appropriate actions for themselves (i.e., self-serve). | 7.Particular data is pulled by an analyst in order to answer specific business questions. |
 | |
8. Types · Canned reports, dashboards, and alerts. · Dashboard: These custom-made reports combine different KPIs and reports to provide a comprehensive, high-level view of business performance for specific audiences. Dashboards may include data from various data sources and are also usually fairly static. | 8.Types · Ad hoc responses · Analysis presentations |
Friday, February 13, 2015
C program to find largest and smallest element from a 1D array

#include<stdio.h>
#include<conio.h>
void main()
{
int a[50],i,n,large,small;
clrscr();
printf("How many elements:");
scanf("%d",&n);
printf("Enter the Array:");
for(i=0;i<n;++i)
scanf("%d",&a[i]);
large=small=a[0];
for(i=1;i<n;++i)
{
if(a[i]>large)
large=a[i];
if(a[i]<small)
small=a[i];
}
printf("The largest element is %d",large);
printf("
The smallest element is %d",small);
getch();
}
Send One Dashboard selects input controls to another Dashboard selects values comes from first dashboard selects and sit in Dashboard 2 selects in Pentaho CDE
This post will talk about below scenario........
Scenario Explained:
When you navigate from one dashboard to another dashboard , in some cases you might need to pass the selected parameter values on Dashboard 1 to Dashboard 2 selects.
i.e., In simple terms, it is not the category names passing from any chart on performing click action but it is passing the input controls values from one dashboard selects to another dashboard selects. (Take input controls from DB-1 and make them to sit on input controls of DB-2 and then allow user to select other inputs if he/she wants on it)
This sample is developed on : C-Tools of 14.06.18.1 stable version of CDE,CDF,CDA with bootstrap supported.
You can perform below :
1) Default values for selects (dates and other drop downs)
2) Select user wished inputs in selects on Dashboard-1.
3) Provide a button/link to drill down to Dashboard-2 with the selected inputs on Dashboard-1.
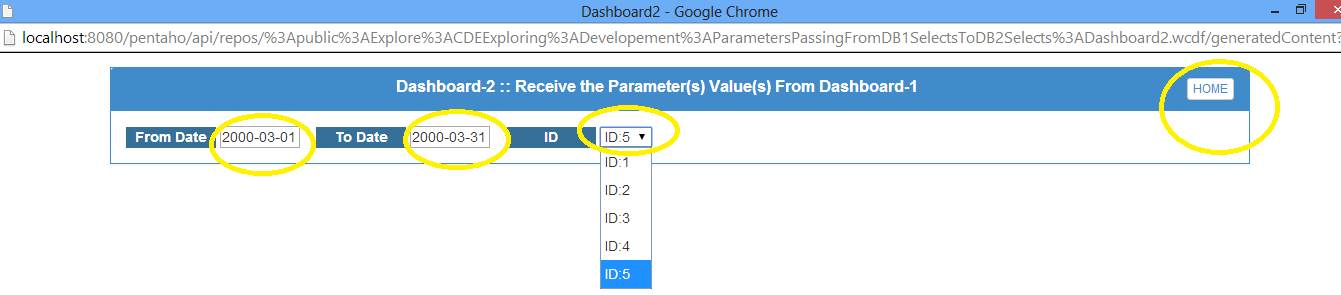
4) On Dashboard-2 selects , the values will coming from Dashboard-1 will be placing.
5) Components(Charts and tables and etc) on Dashboard-2 will listen to these input selects.
6) Change the inputs to other values by selecting here on Dashboard-2 and corresponding components will listen to them again.
7) Link/Button to drill back to Home dashboard -It can be default stage of Dashboard-1 OR reversely can apply the same logic to place the changed values of DB-2 up on DB-1 selects.
In this example I have taken 3 inputs on Dashboard-1.
They are :
1) From Date
2) To Date and
3) ID
Dashboard -1 Development :
Step-1 : Lay Out
Below code is for : A panel with body and to for the place holder for lables and selects(Dates and others) and majorly for a Button(On which we are going to do some magic).
Row ->Column -> HTML
and the Bootstrap HTML code is :
<div class="col-md-12 ">
<div class="panel panel-primary">
<div class="panel-heading">
<h3 class="panel-title" id="DashboardName">Dashboard-1 Send the Selected Parameters to Dashbaord-2 Selects
<button onclick="sendParameters()" type="button" class="btn btn-default btn-xs pull-right">
Dashboard-2
</button>
</h3>
<div class="clearfix"></div>
</div>
<div class="panel-body">
<span class="labelcss"><b>From Date</b></span>
<span id="FromDateSelect"></span>
<span class="labelcss2"><b>To Date</b></span>
<span id="ToDateSelect"></span>
<span class="labelcss3"><b>ID</b></b></span>
<span id="IDSelect"></span>
</div>
</div>
</div>
Step 2: Creating parameters and Selects
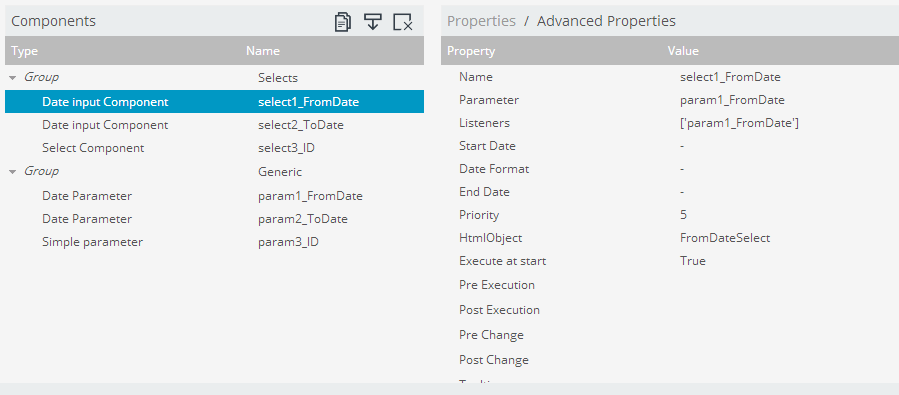
As shown in below figure create 3 parameters and selects for them.
i.e., param1_FromDate, param2_ToDate,param3_ID for parameters
and select1_FromDate, select2_ToDate and select3_ID for selects
Make the selects to listen to the associated parameters.
Note that in this example I have not taken any SQL for drop down selects instead created an array for drop down.
Step : 3
Have a preview of the dashboard once done with step 2 and you can observe there you will not be drill down action when clicking on button component.
Here, lets come back to Lay out section and add a Java Script resource.
Write below code in Java Script Code Snippet
function sendParameters(){
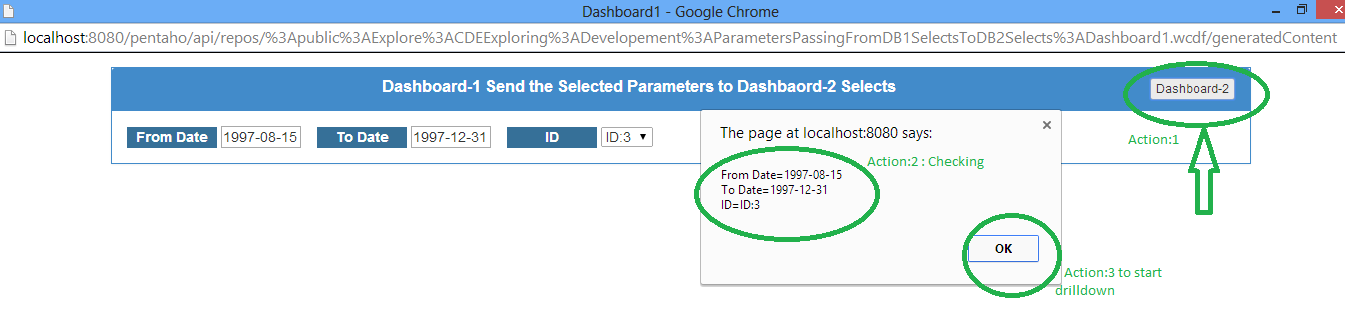
//Test whether your parameters holding the values in an alert message
alert("From Date="+param1_FromDate+"
"+"To Date="+param2_ToDate+"
"+"ID="+param3_ID);
//Perform drill down to 2nd dashboard when clicking on Button Component
var url=
http://localhost:8080/pentaho/api/repos/%3Apublic%3AExplore%3ACDEExploring%3ADevelopement%3AParametersPassingFromDB1SelectsToDB2Selects%3ADashboard2.wcdf/generatedContent;
//Open up 2nd dashboard with parameters passing along with URL
window.location=
url+?send1_FromDate=+param1_FromDate+&send2_ToDate=+param2_ToDate+&send3_ID=+param3_ID;
}
Dashboard -2 Development :
Development of this dashboard has to done separately to take its URL on Dashboard -1 java script
Develop your dashboard with the same input controls (Why to develop again ? Let us SAVE AS with other name and with few modifications - Remove script code, make button component URL in HTML script for HOME dashboard)
Add below script in Java Script Code snippet resource..
i.e., Capturing the values into parameters and internally the selects will take these input values..and later on Dashboard-2 user can select/change on input values on different selection.
param1_FromDate= Dashboards.getQueryParameter(send1_FromDate);
param2_ToDate= Dashboards.getQueryParameter(send2_ToDate);
param3_ID= Dashboards.getQueryParameter(send3_ID);
Dashboards.getQueryParameter(<parameterSenderStringFromDashboad1>) will capture the value from the URL and assign these values to respective parameters.

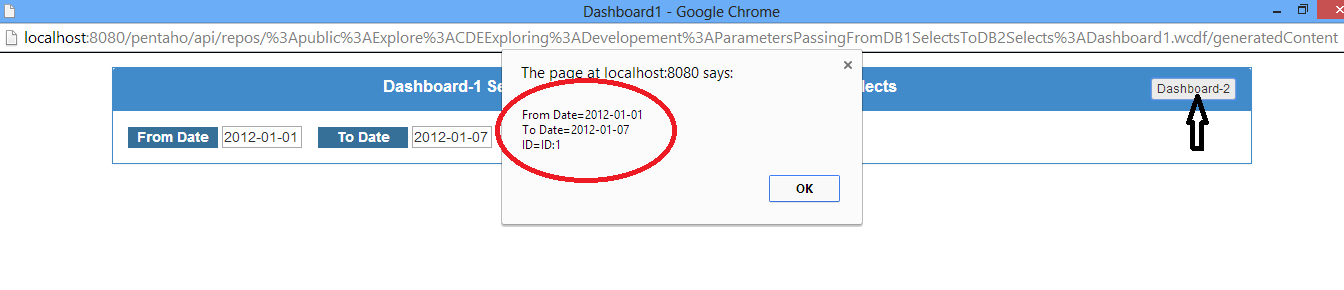 iii) Observe the values for select components on Dashboard-2 after clicking OK button.



Download a quick simple example here : Click Me
Readers and community developers are encouraged to add your feedback ,suggestions and/or improvement of this post in comments section.
Sadakar Pochampalli
BI developer
(Jasper/Pentaho/Talend ETL)
Hyderabad, Telangana.